Audit your own Google Ads account.
Twelve specific things to check yourself, in plain sight, with read-only access. The point isn’t to replace a real audit. The point is to know whether the obvious things are obviously broken, and that’s enough to know whether your next agency conversation is “great work” or “we need to talk.”
If your agency holds the login and you don’t already have read-only access, that’s the first red flag. Get it before doing anything else.
The checks that produce the most “oh, shit” moments.
Each check below has a click path (where to go in Google Ads), a mock of what you’ll see, and the read on it. None of these require any tools beyond your account.
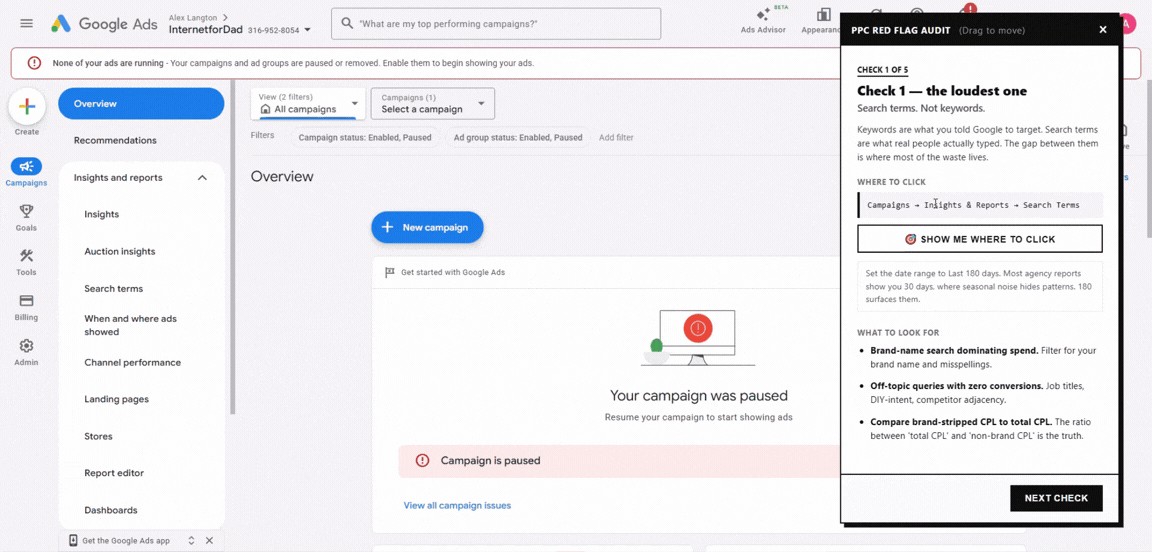
Search terms. Not keywords.
This is the most important distinction in the whole audit. Keywords are what you (or your agency) told Google to target. Search terms are what real people actually typed and you actually paid for. The two are not the same. The gap between them is where most of the waste lives.
Click path: Campaigns → Insights & Reports → Search Terms. Set the date range to Last 180 days. Most agency reports show you 30 days, where seasonal noise hides patterns. 180 surfaces them.
What to look for
- Brand-name search dominating spend. Filter the report for your brand name AND every common misspelling AND any unique product IDs. People searching your brand were going to convert anyway. Counting that as “campaign performance” is how a flat account looks healthy.
- Off-topic queries with zero conversions. Job titles (“careers,” “jobs,” “salary”), DIY-intent (“how to,” “free,” “tutorial”), competitor adjacency. If more than 10 of the top 50 by spend are obviously irrelevant, your negative keyword list isn’t being maintained.
- Compare brand-stripped CPL to total CPL. The ratio between “total CPL” and “non-brand CPL” is the truth. If your agency only ever shows total, that’s the tell.
Demographic and audience bid adjustments.
Bid adjustments are how you tell Google “this person is worth more.” If everyone is bid the same, your agency has no audience strategy. This is one of the easiest places to save money on bad demographics AND capture high-intent traffic that’s already shown interest. Most accounts are doing neither.
Click path (demographics): Audiences → Demographics. Set date range to Last 365 days. Look at conversion rate and CPL by age group.
Click path (audiences): Audiences → Segments. For each segment, note whether it’s set to Targeting or Observation.
What to look for
- Age splits. If your customers skew 35+, is 18–24 still active? In a smart-bidding campaign that takes “all signals” into account, even a small bid-adjustment exclusion on a low-converting age band saves a meaningful slice of spend.
- Audiences in Observation. Observation means Google reports on the audience but doesn’t change bidding. On a mature account, all key segments should be in Targeting mode, with bid adjustments dialled in. Observation-only across the board = data being collected but never acted on.
- Customer-match list missing. If your CRM list isn’t uploaded as an audience, two things you can’t do: (a) exclude existing customers from prospecting, (b) build lookalikes from them. Both are free wins.
- Remarketing not used as a target-only campaign. Remarketing audiences are warm. They deserve their own campaigns with their own messages and bids, not a generic +5% adjustment buried in a prospecting campaign.
Where users actually were when they clicked.
This one is buried, and Google likes it that way. The default “Locations” tab in your campaign view shows matched location, meaning Google says “this user matched your target,” but if your campaign setting is “Presence or interest in,” that match can include people physically located anywhere in the world who showed interest in your area. To see where users actually were, you have to use Report Editor.
Click path: Reports → Predefined reports → or build a custom report. Add the column City (User Location) or Region (User Location) or Country (User Location). The word “User” is what makes it physical-location data.
Set the date range to at least 90 days. Sort by spend.
What to look for
- The User Location column should match your target geo. If you target the US and you see Mexico, Brazil, India, or the Philippines in the User Location column with non-trivial spend, your campaigns are set to “Presence or interest” instead of “Presence.”
- Cross-check conv. rate by user-location region. Spend going to users in your target country with normal conversion rates is fine. Spend going to users elsewhere with near-zero conversion rates is the actual waste.
- Fix is one setting: Campaign settings → Locations → advanced search → switch from “Presence or interest” to “Presence: People in or regularly in your targeted locations.”
If you find significant out-of-country spend here, send me the numbers. This is one of the most common quiet leaks I find.
What is your agency actually counting as a “conversion”?
Three things you have to verify, in order. (1) What is each conversion action: a real lead, or a soft signal like an “engaged visit”? (2) What’s the click-through window? (3) Is view-through enabled with a long window? Each one is a way to inflate the conversion count without producing more business.
Click path: Goals → Summary → Conversions. Click into each conversion action to see its settings.
What to look for
- What is each action? If “Engaged Visit” or “Cart Add” or “Page Scroll” is marked as a Primary conversion alongside form fills, your reported CPL is mixing lead events with browse events. The number on the slide is not a CPL; it’s a soft-signal blend.
- Click-through window. 30 days is normal. 90 days on a 30-day sales cycle is suspicious. It captures conversions that would have happened regardless and assigns them to the campaign.
- View-through. View-through means “saw the ad, didn’t click, converted later.” A 90-day view-through window is an aggressive credit-claim. Performance Max and Display campaigns lean on this. If your account has long view-through windows enabled and PMax running, the reported conversion count is meaningfully inflated.
- Long sales cycles can justify long windows, but only when there’s a model behind it. If you’re B2B with a 6-month cycle, 60 days might be defensible. The question to ask is “why this number?” The answer should not be “Google’s default.”
Phone-call quality.
If your account tracks phone calls as conversions, two things matter. Where the call came from, and how long the call had to last to count. Both have defaults that an inattentive agency leaves alone, and both are how phone-conversion counts get padded.
Click path: Goals → Conversions. Click into each phone-related conversion action.
What to look for
- Source. “Calls from ads” = clicks on your call extension. Half are accidental, especially on mobile. “Calls from website visits” = a dynamic phone number tracked from a real site visit. The second is roughly 200× more valuable per call. They should never be reported as a single combined number.
- Minimum duration to count as a conversion. 1 second = everything counts, including misclicks and spam. 60 seconds means you’re filtering for actual conversations. Most defaults are 60s; a 1s setting is a tell.
- Reported call duration. If average call duration is under 30 seconds, the calls aren’t conversations.
Seven more things to check.
Less visual, more compact. Each one is its own thirty-minute conversation in the next agency call.
-
06
Are search partners turned on?
Click path: Campaign settings → Networks. If “Search Network partners” is checked, Google is showing your ads on third-party search engines and AOL-grade properties. Quality is poor; conversion rates are typically a fraction of Google search itself.
The read: in 95% of accounts, turn it off. The traffic isn’t worth the muddied data.
-
07
How many campaigns are “Limited by budget”? And where is the spend concentrated?
Click path: Campaigns tab → Status column. Anything labelled “Limited by budget” means Google would have spent more if you let it.
The read, two layers: First, are your bids reasonable? You want closer to “100 clicks at $1” than “10 clicks at $10.” Second, within each campaign, segment by keyword and look at spend share. If 90% of a campaign’s spend goes to a single high-volume / low-intent keyword (think “label maker”), that keyword should be split into its own campaign with audience-targeting overlays. At a real account I run, “label maker” lives in its own campaign split across 20 ad groups by age, remarketing list, and in-market segment, precisely because it’s too important to leave undifferentiated.
-
08
What’s the match-type spread of your spend?
Click path: Search Keywords tab → segment by Match Type.
The read: if the majority of spend is on Broad match without an audience-only collar, you’re bleeding. Broad can work, but only when paired with audience overlays in Targeting mode, especially in B2B. The search-terms report from Check 1 will already have shown you whether broad is well-behaved or feral.
-
09
Are there any experiments running?
Click path: Experiments. (Sometimes nested under Campaigns → Drafts & experiments.)
The read: “We ran one in March” is not a testing program. Real practitioners always have something running: ad-copy A/B, landing-page variant, bid-strategy comparison. If Experiments is empty or stale, your agency isn’t iterating; they’re holding.
-
10
What does change history actually show?
Click path: Tools → Change History. Filter to last 30 days.
The read: mentally exclude the noise: automated changes, label updates, budget tweaks, system-applied recommendations. What’s left? Real changes look like keywords added, negatives added, ad copy revised, bids adjusted, structural moves. If those are sparse, your agency isn’t doing the work; they’re collecting the retainer.
-
11
Are landing pages aligned to keyword intent?
Click path: Pull the Landing Pages report. Cross-reference each top-spend page against the keywords sending traffic there.
The read: is “label maker pricing” sending traffic to your homepage? Is “label maker for restaurants” sending traffic to a generic /products page? Is anything redirecting or 404ing? Worst case: every paid click goes to /. (A site-wide tool to flag broken landing pages is on the roadmap below.)
-
12
Are ad extensions current and complete?
Click path: Ads & assets → Assets.
The read: check sitelinks (4–6 fresh ones?), callouts (specific value props or generic fluff?), structured snippets, price extensions, call extensions. Old or missing extensions cap your CTR, and they’re free real estate. If call extensions are running, see Check 5 for what to actually track.
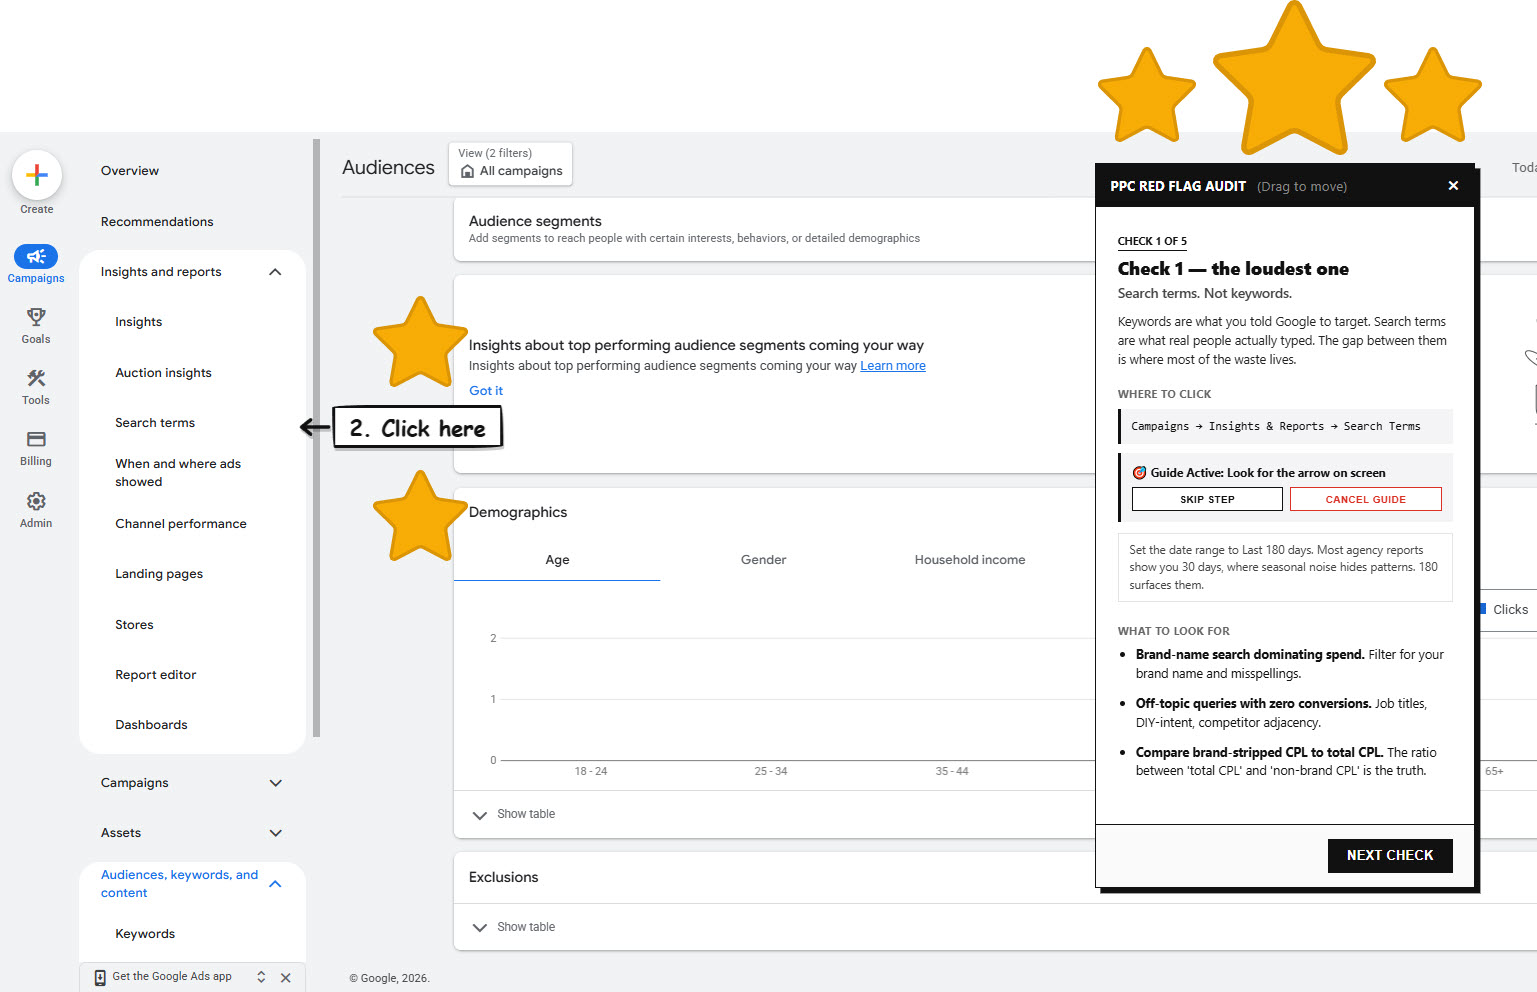
A Chrome extension that runs five of these checks on your live screen.
Click the toolbar icon. The audit panel opens, one check at a time, with a “Show me where to click” button that draws a hand-drawn arrow at the exact tab to open. No screenshots to cross-reference, no guessing where Google buried the report.
On a phone? Chrome extensions only install on a desktop browser. Email yourself this page and finish the install when you’re back at your computer.
What it covers
- Search terms. Where the brand-name spend is hiding and where broad match is feral.
- Audience and demographic bid adjustments. Whether your account has an audience strategy, or just “everyone gets the same bid.”
- User-location report. Where users physically were when they clicked, not the “matched” default Google shows you.
- Conversion-action settings. What’s actually being counted as a conversion, the click-through window, the view-through window.
- Phone-call quality. Source and minimum-duration thresholds. Padded counts vs. real conversations.
Privacy and security
For your IT team, in one paragraph:
- Runs entirely in your browser. No backend, no servers, no API calls leave your machine. Nothing about your account, your queries, or your spend is transmitted anywhere.
- No telemetry, no analytics. The extension does not phone home, collect usage data, or report errors back to me.
activeTabpermission only. The extension can only read the Google Ads tab, and only while you have the panel open. It can’t see other tabs, your history, or background data.- Source is in the zip. Before you install, unzip and read it. One
manifest.json, two short scripts, one stylesheet. Have your security team review if they need to.
Install it (manual)
Not on the Chrome Web Store yet. Five steps, about two minutes:
- Download ppc-red-flag-auditor.zip.
- Unzip the file.
- In Chrome, open
chrome://extensions. - Toggle Developer mode on (top right of the page).
- Click Load unpacked and pick the unzipped folder.
Then visit ads.google.com and click the red-flag icon in your toolbar to launch the audit.
Found something concerning?
Book a free full-service audit this month. I go through the account, listen to your agency call, and deliver a written report on what I find. No charge, no pitch.